
Support teams that track too many numbers end up managing none of them well. This guide breaks down the 12 customer service metrics worth tracking, grouped by speed, quality, and workload, with benchmarks and how to improve each.
Why tracking the right metrics matters
Support teams that track too many metrics end up optimizing for none of them. The goal is not a dashboard full of numbers. It is a small set of metrics that tell you, at a glance, whether support is fast, whether it is good, and where the next bottleneck is.
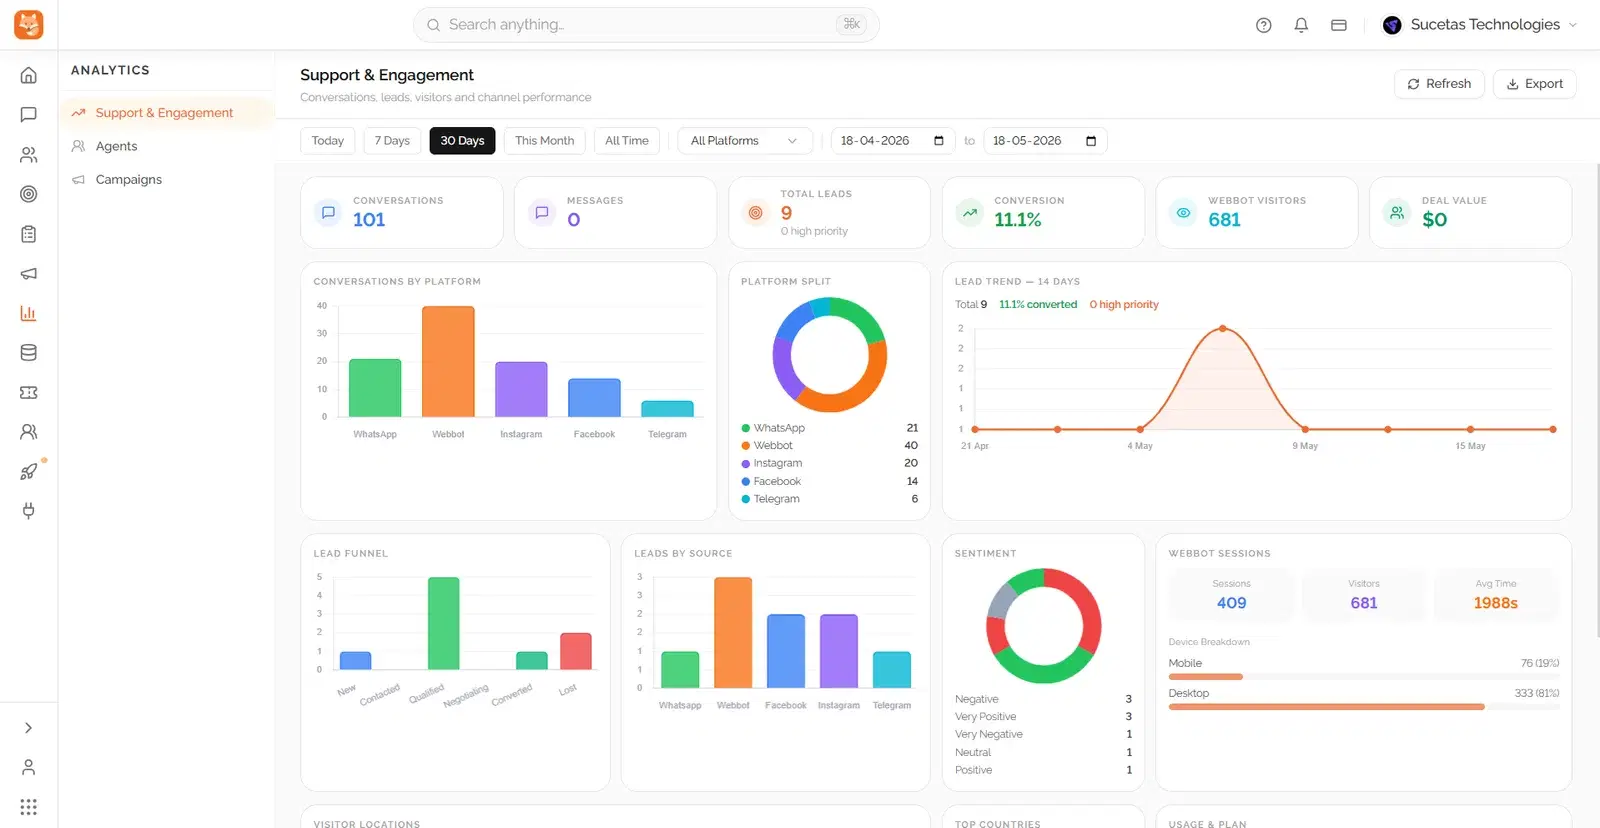
Speed metrics
1. First response time (FRT)
How long a customer waits for the first reply, across any channel. This is the single biggest driver of satisfaction. Customers judge a business on response speed before they judge the quality of the answer. Use a response time calculator to benchmark your current team against industry standards.
| Channel | Good FRT | Excellent FRT |
|---|---|---|
| Live chat / WhatsApp | Under 5 minutes | Under 1 minute (often seconds with AI) |
| Under 4 hours | Under 1 hour | |
| Social media | Under 1 hour | Under 15 minutes |
2. Average resolution time
How long it takes from ticket creation to full resolution, not just the first reply. This matters most for complex issues that need investigation or escalation. A fast first response with a slow resolution still frustrates customers.
3. Backlog / open ticket trend
Whether your open ticket count is growing or shrinking week over week. A steadily growing backlog is an early warning sign long before customers start complaining loudly.
Quality metrics
4. Customer Satisfaction Score (CSAT)
A simple post-interaction rating ("How satisfied were you with this support experience?") averaged across responses. CSAT is the most direct read on whether support is actually helping, and it is cheap to collect. A one-question survey right after ticket close gets far higher response rates than a long form.
5. Net Promoter Score (NPS)
Measures loyalty rather than satisfaction with a single interaction, by asking "how likely are you to recommend us?". Useful as a broader relationship health check, less useful for diagnosing a specific support issue.
6. First Contact Resolution (FCR)
The percentage of tickets resolved without needing a follow-up. Low FCR usually means agents lack the information, authority, or tools to close the loop on the first try. A better knowledge base often fixes it.
7. Customer Effort Score (CES)
Asks how easy it was to get an issue resolved. Research consistently shows effort predicts loyalty better than satisfaction alone. A customer who got help easily is more likely to stay than one who was merely satisfied after a struggle.
Workload & efficiency metrics
8. Ticket volume by channel
Where your support requests actually come from. Volume shifting toward chat or WhatsApp signals where to invest in faster response tooling.
Include phone calls in the same channel review. For calls handled by a Dunefox AI receptionist, track outcomes, intent, transcripts, and handoff reasons through Dunefox analytics instead of treating call volume as an operational blind spot.
9. Tickets per agent
A workload indicator. Too high and quality slips. Too low and you are over-staffed relative to demand.
10. Automation / deflection rate
The percentage of queries resolved by a chatbot or self-service without a human agent. As AI customer support handles more repetitive volume, this metric becomes one of the clearest ROI indicators for automation investment.
11. Escalation rate
The percentage of tickets that need to move up a tier. Rising escalation rates often point to a knowledge gap at the first line of support.
12. Agent utilization
How much of an agent's time is spent on active support work versus idle or administrative time. It is useful for staffing decisions, especially around peak hours.
Pick five metrics, review them weekly, and act on what you see. A dashboard of twenty metrics nobody checks is worse than five that actually change behavior.
Benchmark your team's response time for free
Use Dunefox's free response time calculator to see how your team compares to industry benchmarks, then see how AI-powered customer service automation can cut first response time to seconds.
Frequently Asked Questions
The core set most teams should track is: first response time, resolution time, CSAT (customer satisfaction score), first contact resolution rate, and ticket volume trends. Together these show speed, quality, and workload, the three dimensions that matter most for support performance.
See exactly how your response time and resolution rate compare to industry benchmarks. Free, no sign-up.
Try the response time calculator